

15 Min Read
Introducing Kafka Lag Exporter, a tool to make it easy to view consumer group metrics using Kubernetes, Prometheus, and Grafana. Kafka Lag Exporter can run anywhere, but it provides features to run easily on Kubernetes clusters against Strimzi Kafka clusters using the Prometheus and Grafana monitoring stack.
Lightbend has spent a lot of time working with Apache Kafka on Kubernetes. We’ve helped many of our clients to run high throughput, low latency data streaming applications on Lightbend Platform, and understanding consumer group lag is critical to ensuring low latency processing. This project was started to facilitate an easy way to discover consumer group lag & latency of Akka Streams and Spark streamlets in Lightbend Pipelines, but more generally it can report consumer group metrics of any Kafka application that commits offsets back to Kafka.
Before discussing Kafka Lag Exporter’s features, it’s important to have an understanding of Kafka consumer group lag.
Kafka consumer group lag is one of the most important metrics to monitor on a data streaming platform. When consuming messages from Kafka it is common practice to use a consumer group, which offer a number of features that make it easier to scale up/out streaming applications. At a high level, they allow us to do the following.
Member applications of a consumer group may commit offsets to Kafka to indicate that they’ve been successfully processed (at-least-once semantics) or successfully received (at-most-once semantics). The main purpose behind committing is to provide an easy way for applications to manage their current position in a partition so that if a consumer group member stops for any reason (error, consumer group rebalance, graceful shutdown) that it can resume from the last committed offset (+1) when it’s active again.
Committing offsets to Kafka is not strictly necessary to maintain consumer group position–you may also choose to store offsets yourself. Stream processing frameworks like Spark and Flink will perform offset management internally on fault tolerant distributed block storage (i.e. HDFS, Ceph, etc.) to enable stateful streaming workloads in a fault tolerant manner.
Custom user applications may want to perform their own offset management so they can easily replay a partition’s messages from different positions in the log. However, committing offsets to Kafka for simple streaming applications, or in addition to managing offsets yourself, enables an easy way to track the progress of all partitions being consumed in a consumer group.
One of the required parameters needed to setup a consumer is a topic subscription. This can be represented as a single topic, multiple topics, or a set of individual topic partitions, that we want to consume from. The set of partitions described by the topic subscription is distributed across all the members of a consumer group (generally scaled replicas of the same application). Once the member receives its assignment it will begin consuming messages that exist in its subset of partitions.
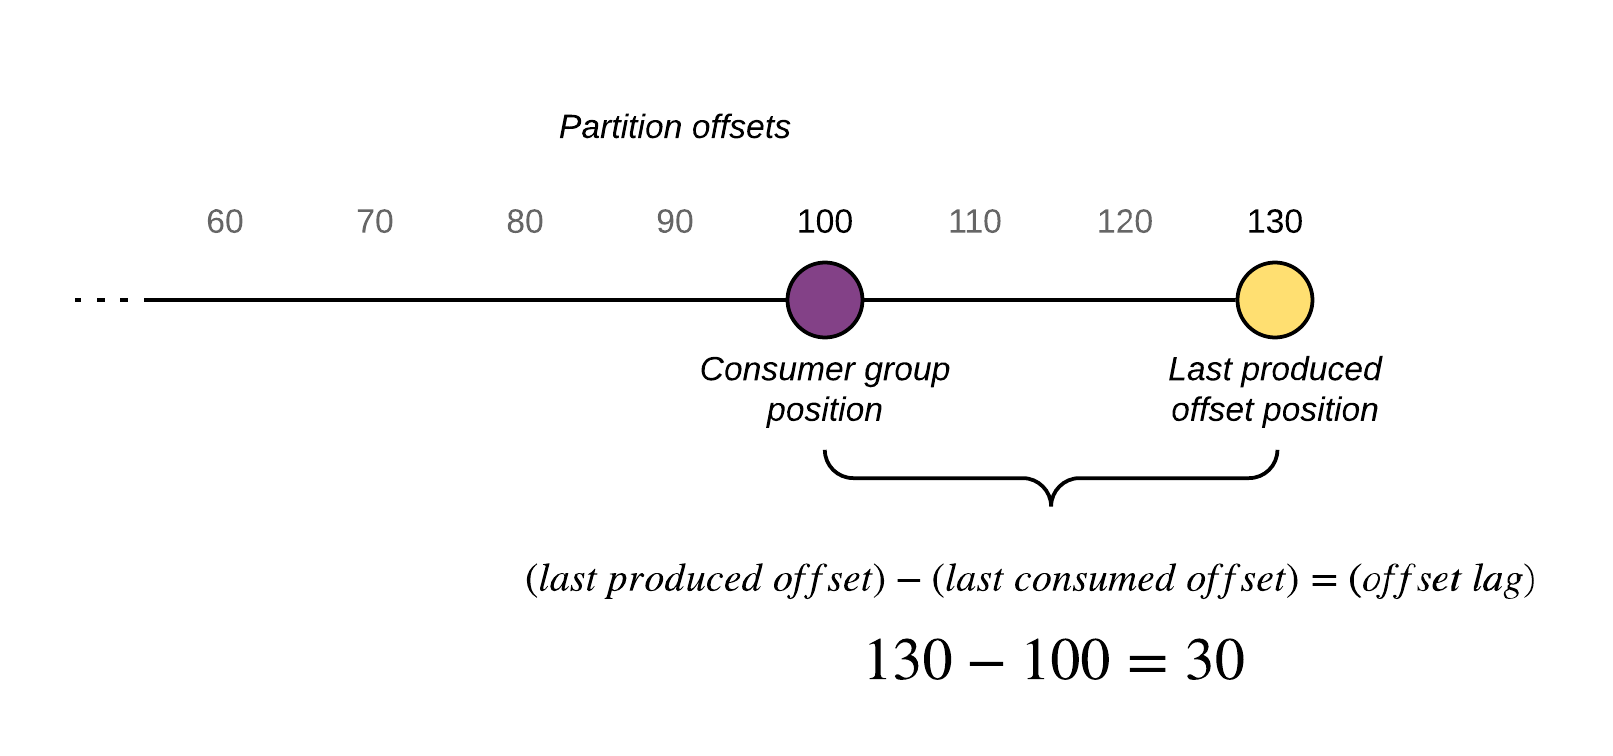
Consumer group lag is the difference between the last produced message (the latest message available) and the last committed message (the last processed or read message) of a partition. For example, if there are 130 total messages in a partition and we’ve committed up to 100, then the consumer group lag for that partition is 30 messages/offsets.
There are consequences for having a large consumer group lag; this indicates how far behind your application is in processing up-to-date information. This depends on the functional requirements for your streaming platform, but in most cases, we want to keep the lag (aka latency) of our application to be as little as possible. Another consequence is that if lag is always increasing then it’s inevitable that we will start losing information at some point because the data will be evicted from the queue by Kafka partition retention policies so that the Kafka broker doesn’t run out of disk.
A caveat of measuring consumer group lag is that it’s inherently imprecise. There’s no way to retrieve both the offset of a consumer group in a partition and the last produced message in a partition in a single atomic operation. Most consumer group lag monitoring software will perform the metadata requests in parallel (Kafka Lag Exporter does this), or shortly one after another, in order to get the best snapshot of the current state. Adding to this imprecision is the fact that committing an offset by the consumer introduces latency as well. Therefore the currently measured consumer group offset might not be the consumer’s actual current position. Nonetheless, measuring consumer group lag even with these caveats is still a valuable metric to monitor, but you should be aware of its fidelity and use it in conjunction with other information before drawing a conclusion about the health of your consumer group.
Watch: Running Kafka on Kubernetes with Strimzi 
Kafka Lag Exporter is an Akka Typed application written in Scala. Kafka Lag Exporter will poll Kafka for consumer group information and transform it into Prometheus metrics. A Prometheus server will then scrape and store these metrics so that they can be made available to any downstream metrics monitoring software, such as for the purposes of alerting of dashboarding. Plotting consumer group lag is important to help us our tune our applications and infrastructure.
There are many consumer group lag projects available in the Kafka ecosystem. Kafka Lag Exporter has several features that make it stand out from other projects.
Prometheus is emerging as the de facto standard way to represent metrics in a modern cross-platform manner. Kafka Lag Exporter exposes several metrics as an HTTP endpoint that can be readily scraped by Prometheus. When installed using Helm and when enabling the Kubernetes pod self-discovery features within Prometheus server, Prometheus server will automatically detect the HTTP endpoint and scrape its data.
kafka_consumergroup_group_offset
Labels: cluster_name, group, topic, partition, state, is_simple_consumer, member_host, consumer_id, client_id
The offset of the last consumed offset for this partition in this topic partition for this group.
kafka_consumergroup_group_lag
Labels: cluster_name, group, topic, partition, state, is_simple_consumer, member_host, consumer_id, client_id
The difference between the last produced offset and the last consumed offset for this partition in this topic partition for this group.
kafka_consumergroup_group_lag_seconds
Labels: cluster_name, group, topic, partition, state, is_simple_consumer, member_host, consumer_id, client_id
The estimated lag in seconds. This metric correlates with lag in offsets. For more information on how this is calculated read the Estimate consumer group lag in time section below.
kafka_consumergroup_group_max_lag
Labels: cluster_name, group, state, is_simple_consumer
The highest (maximum) lag in offsets for a given consumer group.
kafka_consumergroup_group_max_lag_seconds
Labels: cluster_name, group, state, is_simple_consumer
The highest (maximum) lag in time for a given consumer group.
kafka_partition_latest_offset
Labels: cluster_name, topic, partition
The latest offset available for topic partition. Kafka Lag Exporter will calculate a set of partitions for all consumer groups available and then poll for the last produced offset. The last produced offset is used in the calculation of other metrics provided, so it is exported for informational purposes. For example, the accompanying Grafana dashboard makes use of it to visualize the last produced offset and the last consumed offset in certain panels.
Each metric may include the following labels when reported.
cluster_name - Either the statically defined Kafka cluster name, or the metadata.name of the Strimzi Kafka cluster that was discovered with the Strimzi auto-discovery feature.topic - The Kafka topic.partition - The Kafka partition.group - The Kafka consumer group.id.The rest of the labels are passed along from the consumer group metadata requests.
state - The state of the consumer group when the group data was polled.is_simple_consumer - Is this group using the [old] simple consumer API.member_host - The hostname or IP of the machine or container running the consumer group member that is assigned this partition.client_id - The id of the consumer group member. This is usually generated automatically by the group coordinator.consumer_id - The globally unique id of the consumer group member. This is usually a combination of the client_id and a GUID generated by the group coordinator.Prometheus server may add additional labels based on your configuration. For example, Kubernetes pod information about the Kafka Lag Exporter pod where the metrics were scraped from.
One of Kafka Lag Exporter’s more unique features is its ability to estimate the length of time that a consumer group is behind the last produced value for a particular partition, time lag. Offset lag is useful to indicate that the consumer group is lagging, but it doesn’t provide a sense of the actual latency of the consuming application.
For example, a topic with two consumer groups may have different lag characteristics. Application A is a consumer which performs CPU intensive (and slow) business logic on each message it receives. It’s distributed across many consumer group members to handle the high load, but since its processing throughput is slower it takes longer to process each message per partition. Meanwhile, Application B is a consumer which performs a simple ETL operation to land streaming data in another system, such as an HDFS data lake. It may have similar offset lag to Application A, but because it has a higher processing throughput its lag in time may be significantly less.
It’s easier to build monitoring alerts using a time lag measurement than an offset lag measurement because latency is best described in requirements as a unit of time.
There are several ways to calculate time lag. The easiest way would be to parse the message timestamp and subtract it from the current time. However, this requires us to actually poll for messages in each partition that we wish to calculate time lag for. We must download the message payload and parse this information out of a ConsumerRecord. This is an expensive operation to perform and will likely not scale well in the general use case where messages can be of any size (though less than 1MB, unless default broker config is changed) and the number of partitions for any given topic could range into to thousands. However, it would be an interesting feature to explore in the future. It would also be possible to instrument the Kafka consuming application itself to report this metric since it can readily sample messages it's already consuming for their timestamp property and perform the calculation, but this requires each Kafka consuming application to opt into this implementation in order for it to be monitored. Another way to determine time lag is to estimate it based on consumer group lag information we already have available.
Kafka Lag Exporter estimates time lag by either interpolation or extrapolation of the timestamp of when the last consumed offset was first produced. We begin by retrieving the source data from Kafka. We poll the last produced offset for all partitions in all consumer groups and store the offset (x) and current time (y) as a coordinate in a table (the interpolation table) for each partition. This information is retrieved as a metadata call using the KafkaConsumer endOffsets API and does not require us to actually poll for messages. The Kafka Consumer Group coordinator will return the last produced offsets for all the partitions we are subscribed to (the set of all partitions of all consumer groups). Similarly, we use the Kafka AdminClient’s listConsumerGroupOffsets API to poll for consumer group metadata from all consumer groups to get the last consumed offset for each partition in a consumer group.
Once we’ve built up an interpolation table of at least two values we can begin estimating time lag by performing the following operations (some edge cases are omitted for clarity) for each last consumed offset of each partition.
Below you will find a diagram that demonstrates the interpolation use case.

The extrapolation use case uses different points in the interpolation table (the first and last points), but the calculation is the same.
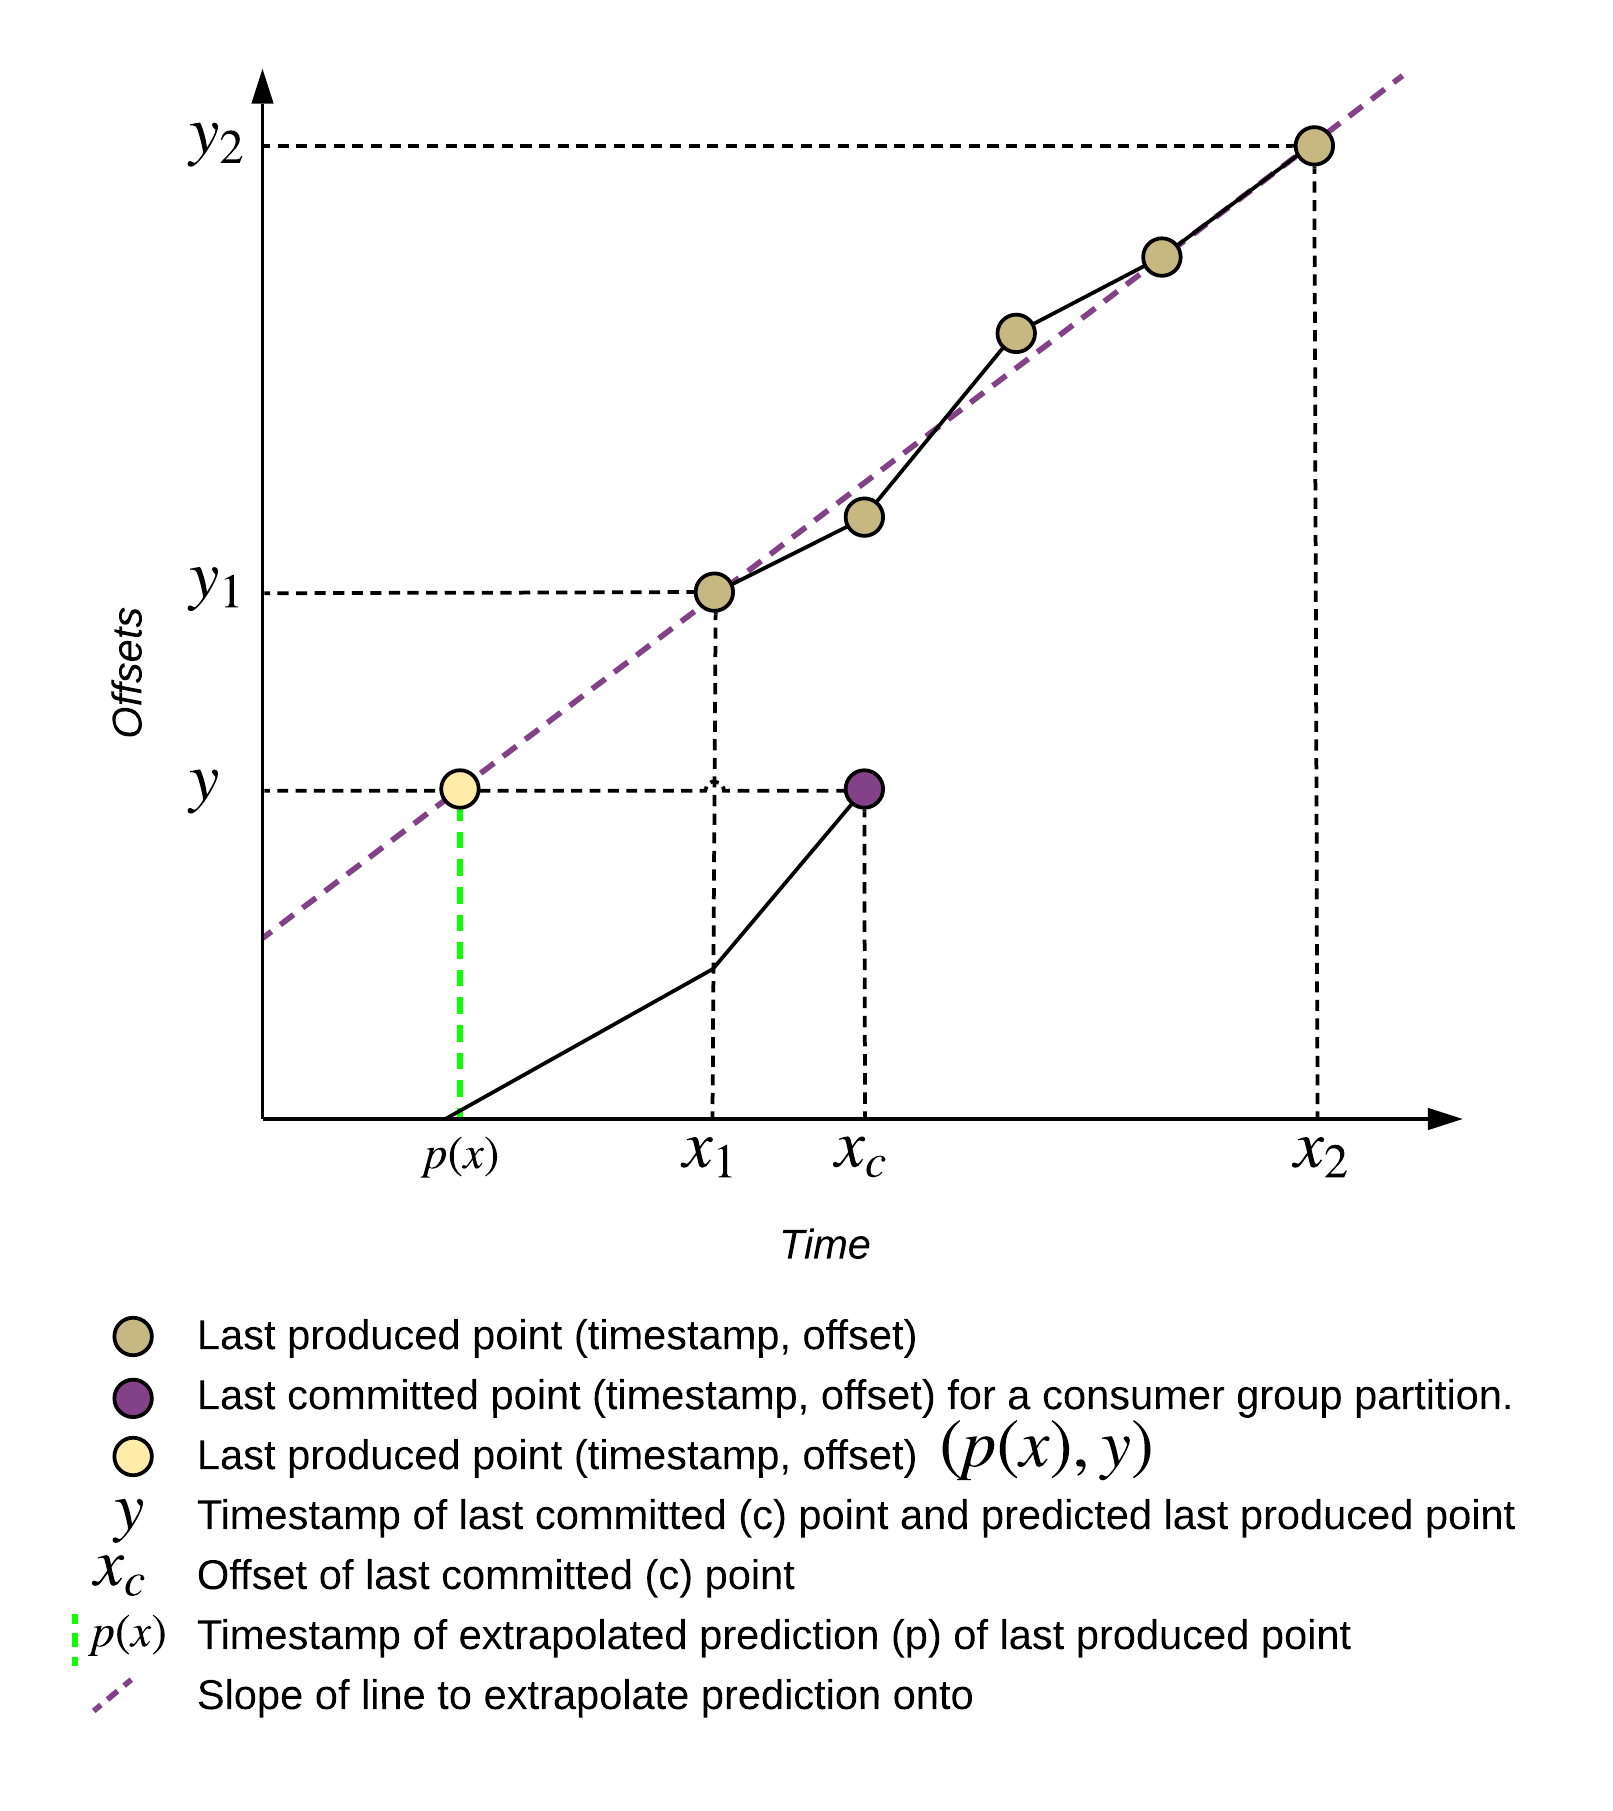
Interpolation is always desirable because we can be more assured that the prediction will be more accurate because we’re plotting a point within two points of our existing dataset. Extrapolation will always be less accurate because we’re predicting points that may be a fair distance away from our dataset.
This feature is based on a similar feature from a monitoring software known as OpsClarity (since acquired by Lightbend), where it was described as queue latency.
Akka Platform uses Kubernetes (more specifically, Red Hat OpenShift) to run supported infrastructure for reactive and data streaming platforms. The Kafka Lag Exporter repository hosts a Helm Chart to easily deploy the Kafka Lag Exporter into existing Kubernetes and OpenShift clusters. The Helm Chart may be installed directly by cloning the project’s GitHub repository and checking out the appropriate release tag, or by referencing the tarball artifact from the appropriate GitHub release.
Helm will deploy all the necessary Kubernetes resources required to run Kafka Lag Exporter, as well as provide a nice configuration API to configure the application and its deployment.
For example, here is how you install the Kafka Lag Exporter in one command:
helm install \
https://github.com/lightbend/kafka-lag-exporter/releases/download/v0.4.0/kafka-lag-exporter-0.4.0.tgz
To learn more about specific options that can be overridden see the values.yaml file in the project repository.
Strimzi represents the most stable Apache Kafka on Kubenetes project available today. It’s closest rival project would be the Confluent Operator from Confluent itself, but this is commercial in nature and makes it difficult to make a comparison. The Strimzi project is led by a team of Software Engineers in Red Hat IoT & Messaging department. It’s part of a broader commercial offering from Red Hat known as Red Hat AMQ as well as the Lightbend Platform. Kafka Lag Exporter uses Kubernetes to automatically watch for Strimzi Kafka resources which can be used to automatically configure Kafka connection information in Kafka Lag Exporter.
To use this feature, simply enable the Strimzi watcher when installing or updating the Kafka Lag Exporter Helm Chart. You must have Strimzi installed before you can use this feature.
helm install \
https://github.com/lightbend/kafka-lag-exporter/releases/download/v0.4.0/kafka-lag-exporter-0.4.0.tgz \
--name kafka-lag-exporter \
--namespace kafka-lag-exporter \
--set watchers.strimzi=true
Watch: Running Kafka on Kubernetes with Strimzi
Increasing consumer group lag is a symptom of a common problem in data streaming systems known as the “fast producer, slow consumer” problem. In this scenario, an upstream producer is creating messages faster than a downstream consumer can process them. In most practical situations, if the consumers can never catch up then something in your infrastructure will fail unless you take action to reduce the lag. There are several strategies to do this.
Back-pressuring is Lightbend’s common prescription. This is a terrific solution when you have control over upstream producers of data to prevent fast producers from overloading downstream consumers, causing a cascading failure. Back-pressure is natively supported in Akka and Akka Streams. When using Kafka there is no way for a consumer to back-pressure upstream using provided Kafka features. If you’re using Kafka within your infrastructure then you don’t want to back-pressure through Kafka.
Back-pressure is intentionally not an option in Kafka. In many high throughput streaming use cases, such as IoT, we can’t, or don’t want to, tell the upstream to slow down their production rate. This may be because their production rate is outside of our control, as in the case of a customer hardware device, or a 3rd party data source. This is why Kafka is commonly used on the edge of data streaming infrastructure, so that it may buffer messages quickly and in a persistent and fault tolerant way and provide consuming applications with an opportunity to catch up (reduce lag) by reading at a rate that’s comfortable to them. Using Kafka as a big buffer prevents translating potentially spikey load to our internal infrastructure. You can think of this use case as a data streaming shock absorber implemented with Kafka.
Sometimes simply buffering is not enough and we need to do something about the situation before it’s too late. The Kafka solution to this problem is either to increase the size of the buffer (increase broker retention policies, add more disk), or to add additional processing power to our consumer group by adding more members. Scaling out members allows consumer groups to redistribute partitions over those additional members, which should result in a higher aggregate processing throughput and allow the consumer group to eventually catch up to the latest produced offsets for partitions they’re subscribed to.
Other solutions to the “fast producer, slow consumer” problem include dropping messages by some pattern. For example, drop every n messages or some other criteria. Or drop all messages until we catch up. However, if dropping messages is not acceptable and if lag persists over a long period of time, or worse, it is steadily increasing over time then increasing the buffer or scaling consumer groups is your only alternative.
When monitoring consumer group lag we can handle increasing lag & latency situations manually by regularly reviewing monitoring dashboards, or setting up alerts based on certain thresholds, such as a growth model based on offset or time lag. Or we can be more proactive and “close the loop” by taking automated action. For example, in Kubernetes we can react to lag by automatically modifying a Kubernetes Deployment associated with that consumer group and patch its replicas field to add or remove members to the consumer group.
Kafka Lag Exporter is designed for Prometheus. As a consequence, we can leverage the whole ecosystem of Prometheus-supported monitoring software to setup a monitoring solution. Grafana is a very mature dashboarding solution that lets us build a wide range of monitoring user experiences. The Kafka Lag Exporter bundles an example Grafana dashboard that provides several different ways to visualize the metrics.
The dashboard is split into four sections. The first three sections are relevant to consumer group lag and the fourth are internal JVM metrics reported by Kafka Lag Exporter itself.
The first consumer group sections include an aggregate view of all consumer groups, and the second two sections include one panel each for each consumer group, showing the maximum time lag overlaid with other information.
One of four panels that aggregate all (or top) lag across all consumer groups. The example below shows the kafka_consumergroup_group_max_lag_seconds metric for all consumer groups.

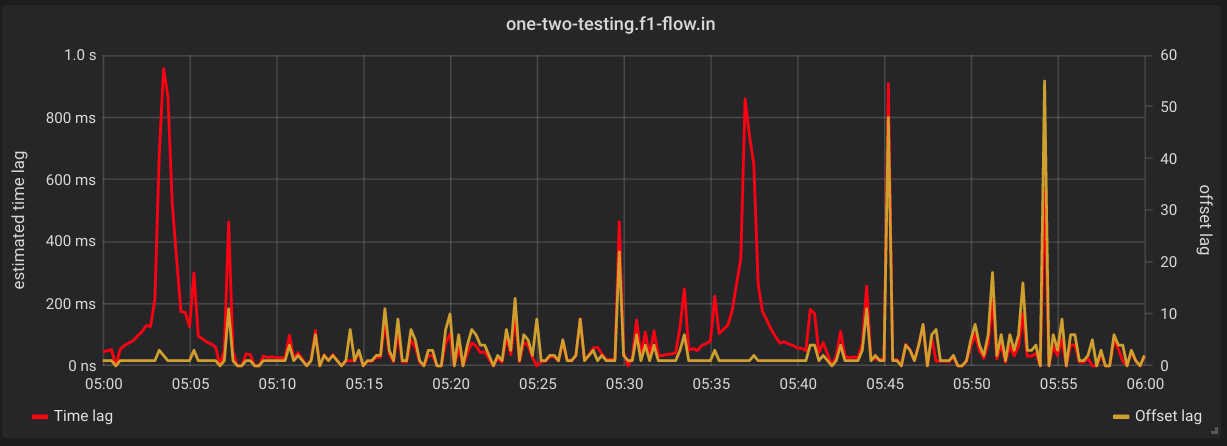
The example below shows time lag on the left Y axis and offset lag on the right Y axis for a single consumer group.
The same consumer group as before with time lag on the left Y axis and a sum of last produced and last committed offsets across all partitions in the consumer group. This is useful to see lag relative to partition subscription depth.

Kafka Lag Exporter 0.4.0 was open sourced and released publicly in tandem with this blog post. Try installing the Helm Chart into your Kubernetes cluster to gain new insights into the latency of your consumer groups. We welcome bug reports and contributions. For more information on how to contribute fork the GitHub repository and consult its internal documentation.
Learn more about working with Kafka and Kubernetes in Sean's webinar Running Kafka On Kubernetes With Strimzi For Real-Time Streaming Applications.
